Using a combination of field parameters and row level security, you can create visuals that work for all security roles even when the visual contains elements that are blocked to any roles through object level security.
We implement OLS on the model elements and RLS on the field parameters/visual elements to achieve this. We can also modelling our data in a way that protects a customer’s attributes while providing a seamless report experience.
Best of all, this can be a complete silent feature of your report since the explicit selection of field parameter components is not neccessary (though can add additional functionality!).
We have made this beautiful graph that is giving us the exact insights we want: sales by customer location and gender:

In this scenario, we will simulate a real life example of security roles where:
- A user cannot see a per country breakdown
- A user cannot see a per gender breakdown
Avoiding multiple reports or pages that have the same information repeated.
Of course, when the security role is applied, the visual is no longer available:


Our goal is to:
- When country is unavailable, keep the continent rollup
- When gender is unavailable, remove the legend
Protecting the X-Axis (Country)
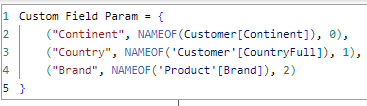
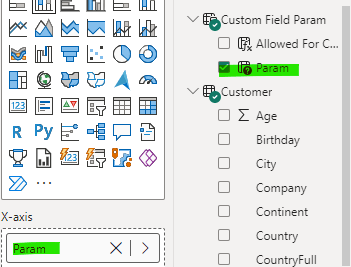
We can create a field parameter that has the column attribute(s) that could be protected:
And apply a security role to this table that will result in the relevant rows being hidden. So, to be clear:
- We have created Object Level Security on the model column, so that Customer[CountryFull] is completely hidden
- We have created Row Level Secuity on the field parameter table, so that NAMEOF(Customer[Country]) never attempts evaluation in the context of the user
The safest way to impliment the RLS, allowing for updates to the table in the future, is by creating a calculated column with a switch statement. This means that, as today’s developer, I am explicitly saying which values for NAMEOF(Table[Column]) are allowed for this role, Any changes to this table in the future must be explicitly given access, no inheritence is implied because all parameters are explicitly defined in it. This protects the integrity of what we build today by forcing the next person to think about what they’re doing!
Allowed For Country Role =
VAR allowedForCountry = {NAMEOF(Customer[Continent]), NAMEOF('Product'[Brand])}
VAR blockedForCountry = {NAMEOF(Customer[CountryFull])}
RETURN
SWITCH(
    TRUE(),
    [Country and Continent Fields] IN allowedForCountry, TRUE(),
    [Country and Continent Fields] IN blockedForCountry, FALSE(),
    BLANK()
)

From here, setting up the RLS component is trivial:

By switching the Continent and Country values in our X axis to the field parameter value, we force evaluation of that table at the time of rendering to get the fields for the visual. This means that our unrestricted role continues to see Continent and Country, but our secured role can only see the Continent.


The tradeoff in setting up the security roles and field parameters is well worth it when you consider we only have one version of the graph to maintain. The biggest callout to the developer is to ensure you have the visual set to the most expansive expand-level-in-hierarchy you want your unrestricted users to see. This means that the expansion is default for unrestricted users, but “rolls up” for the restricted users.
You’ll note that I didn’t use a field slicer to produce the above, as the default behaviour meets the initial ask. We could easily enable the parameter slicer to give each granular control over the visual that is still tailored to their role:


Protecting the legend
Using the same technique as above, we can create a field parameter containing the Gender object column, and apply RLS to the table.

The graph will no longer show any legend. A great trick to conditionally rename the graph is to determine if ALL(‘Gender Param’) is empty, and if so remove the “and gender” component of the title.

What you will notice is that each bar has the sales amount in dollars, whereas before it was the gender split. This is because, under this security rule, there is no access to Customer[Gender], a predecate for our Sales Amount By Gender measure:
Sales Amount By Gender =
var selectedSales = [Sales Amount]
var removedGender = CALCULATE([Sales Amount], REMOVEFILTERS(Customer[Gender]) )
RETURN DIVIDE (selectedSales, removedGender)
As soon as you enter the restricted Gender role, this measure disappears from the model because a dependency on Customer[Gender] is detected. This means the visual label falls back to it’s default because it detects a misconfiguration (at least it doesn’t break the whole visual!)
I would suggest that a business rule hiding personally identifiable information (name, address, etc) is much better practice than hiding just one attribute like gender.
“Fixing” this label is not really the most logical next step from here. There is a loophole where you can returning a specific value for a protected measure but contains loophole that can negate your security, which I will explain in a future post.